Trend lines are one of the most commonly used methods in the technical analysis of the financial markets. There is no doubt, that there are numerous trading systems built around trading with trend lines. While some trading systems combine technical indicators with trend lines, there are others require the trader’s discretion.
Regardless of what trend line trading systems you have come across, one thing for certain is that they are not always profitable. One of the main goals to be a successful trader is in finding a trading strategy that gives you improved odds of trading.
In this trading system which uses trend lines, we make use of two different technical analysis methods. This ensures that the probability of trading with trend lines increases a lot.
And one additional benefit of this trading system is, that it can be automated with the Trendline Trader EA. With the Trendline Trader EA, you can even trade on lower time frames besides a normal day job.
For the curious ones, this trend line-based trading system uses the one-hour chart time frame. There will be many trading opportunities and you can qualify these trading setups based on the rules that we outline.
Typically, the reward/risk ratio for each trade setup is quite high with this method.
We will start with the basics now and then we will slowly evolve to the complete trading system.
What is a trend line?
Before we go into the details of this trading system, we will first explain what a trend line is. While you might be aware, it is essential to refresh your memory about trend lines and understand the market structure and context behind it.
A trend line is a sloping line which connects the consecutive lows or highs in a price chart. There are two types of trend lines.
A rising trend line denotes that prices are in an uptrend. This rising trend line is formed by connecting the consecutive lows in the price. The latest lows are of course, higher compared to the previous lows formed.
A falling trend line signifies that prices are in a downtrend. A falling trend line is formed by connecting the consecutive lower highs in a price.
When a trend line is breached, it can signify that prices are posting a correction, or a change of trend is occurring. This can vary depending on the time frame that you are looking at to analyze the trend.
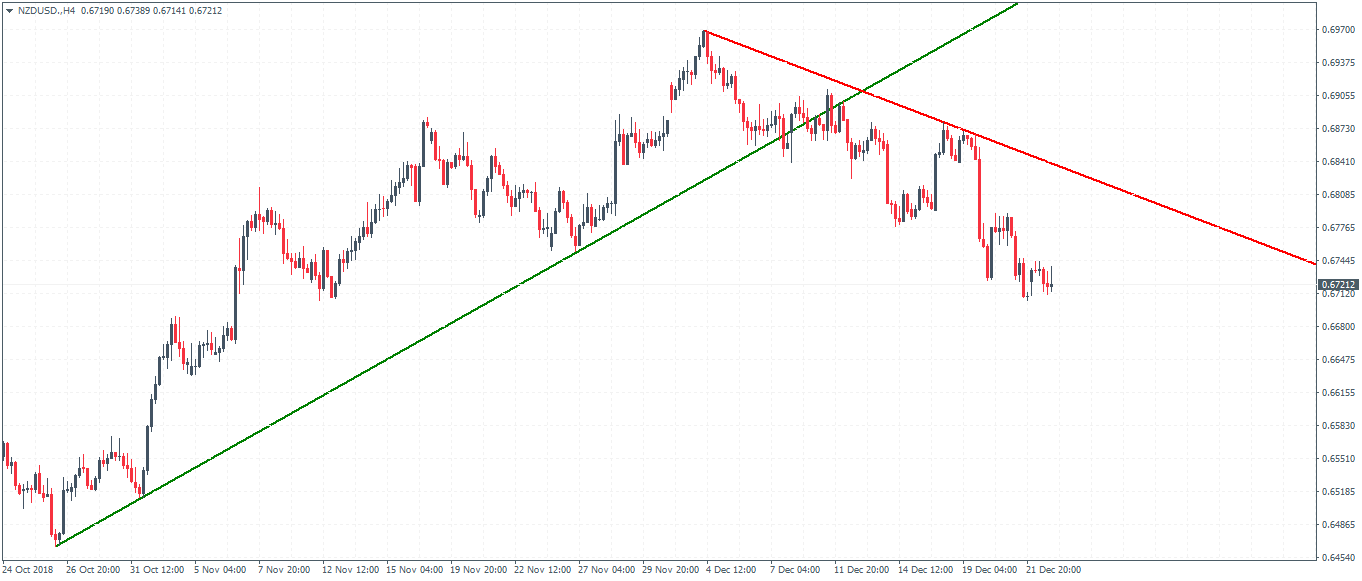
The chart below shows a rising and a falling trend line, indicating the uptrend and the downtrend, identified by the red and green trend lines.
What is a steeper trend line?
Trend lines are formed when price settles into a trend. The strength of the trend defines the angle of the trend line.
The steeper a trend line gets, the greater the chances that price will snap back. This is also what is known as the reversion to the mean. Later I will explain in detail why a steeper trend line adds to the probabilities that the price will snap back.
The following screenshot shows two rising trend lines. A thicker longer-term trend line which is less steep and a thinner but steeper trend line.

In the above chart, Figure 2, you can see that the thicker rising trend line is the main trend line of the chart. The steeper trend line shows a smaller and faster trend within the main trend.
What you will notice here is that after price breaks the steeper trend line, price action eventually falls to the thicker main trend line.
In the next section of this article, we will not go into the details of this trading strategy.
The two-trend line trading strategy
We will outline this trading strategy into the following three steps.
- Chart setup
- Analysis and qualification
- Trade management
The two-trend line system makes use of momentum. As momentum starts to fall, price action tends to gravitate to the mean price. This is also known as the reversion to the mean in trading terms as explained above.
As long as momentum is building up, price tends to move in the same direction as it previously was. As an analogy in physics, this can be explained with one of Newton’s law, which states that an object continues to move in the same direction unless it is acted upon by an external force.
As momentum wanes, it is more difficult for the price to continue rising or falling. In trading terminology, this can be seen as buyers or sellers who dominated the trend start to ease. This leads to fading momentum. Eventually, price capitulates and reverses direction.
When this happens, you can expect the reversal to be sudden and sharp. It should be noted that at this point, there is momentum, but just price reverting to its mean (or the main trend line which depicts the average price).
As the direction changes, the price will not attract new buyers or sellers. This, in turn, builds up momentum and pushes price in the opposite direction.
One noticeable thing about this trading strategy is that when our setups occur, you can expect the target to be reached rather quickly. This gives you the advantage of not having to hold on to your positions for long periods of time.
1. The chart setup
The first step is of course to identify the chart. You can use this trading method on any instrument of your choice. However, it is ideal that you apply this trading strategy to only the most liquid of currency pairs or other markets such as futures or stocks.
The time frame of the chart is not relevant. Price needs to be moving in a strong and steady trend for this setup to work. Once you identify a trending chart, you will then draw the rising or the falling trend line by connecting the consecutive highs or the lows respectively.
This first trend line should slope with an approximate 45-degree angle. Once this main trend line is constructed, the next step is to wait for price action to evolve. Evidently, at some point, you should start to see price gaining more momentum.
This should result in another trend line that is steeper than the first and obviously shorter in duration.
2. Analysis and qualification
After setting up your chart, the next step is to qualify the trade and to ascertain if the trade setup is worth trading or not. You will determine this by checking the distance between the two trend lines. The more space there is between the two trend lines, the greater the reward for the trade.
When you find such a setup, you need to be patient and wait for price action to give you further clues.
Usually, near the shorter trend line, prices can either turn flat, trading in a range or they can post a fake-out before changing direction. To determine this, you can use the rectangle tool and draw the range that is established.
When the range is broken in the opposite direction to the trend that was established, you can then enter the trade.
3. Trade management
Once you are ready to enter the trade, your trade management is simple. Your stops come in at the recent fake-out (high or the low) prior to the change in direction of the trend. The range’s low or the high is your entry point while you set your target to the main trend line which acts as the reference point.
Combining the above rules, let’s now look at some trade examples.
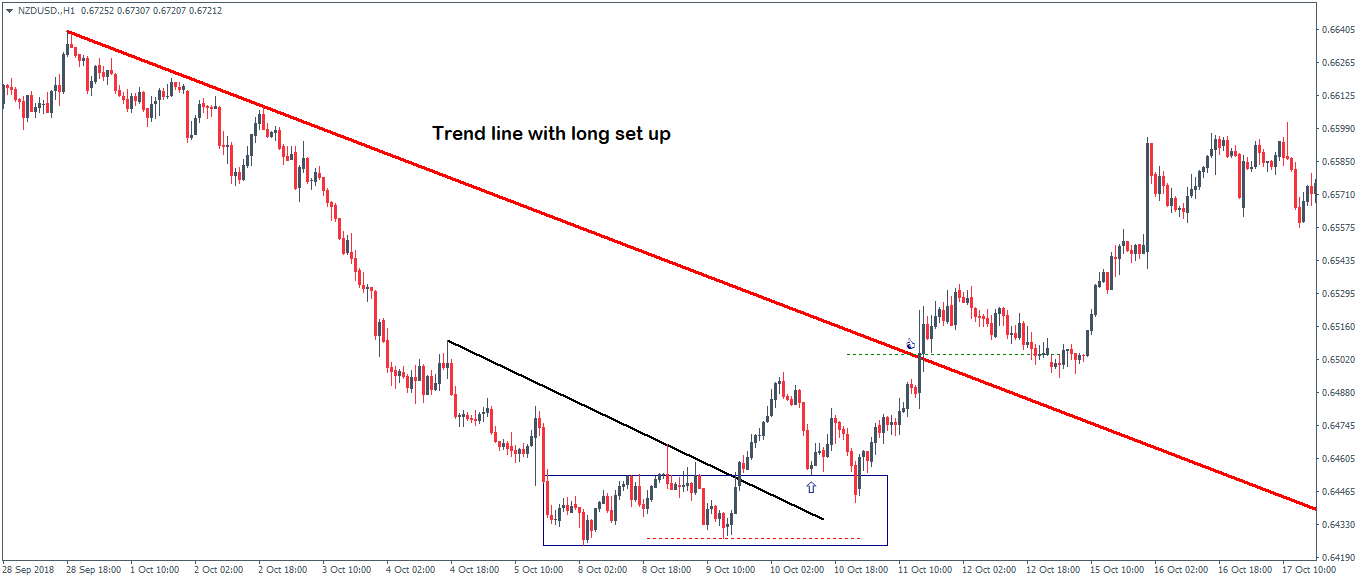
In Figure 3, we see an example of a long trade setup. Here, the red trend line is the main falling trend line. This main trend line has a normal slope.
Later in the trend, you can see that as the price comes near the bottom, we plot another trend line which is shorter in duration and is steeper than normal. Near the end of this smaller trend line, you can see that price turns flat.
This is identified by the rectangle that is plotted on the chart. It depicts the side-way range of price. When this range is breached, we take a long position with stops at the lower end of the rectangle. The profit level is set to the main trend line.

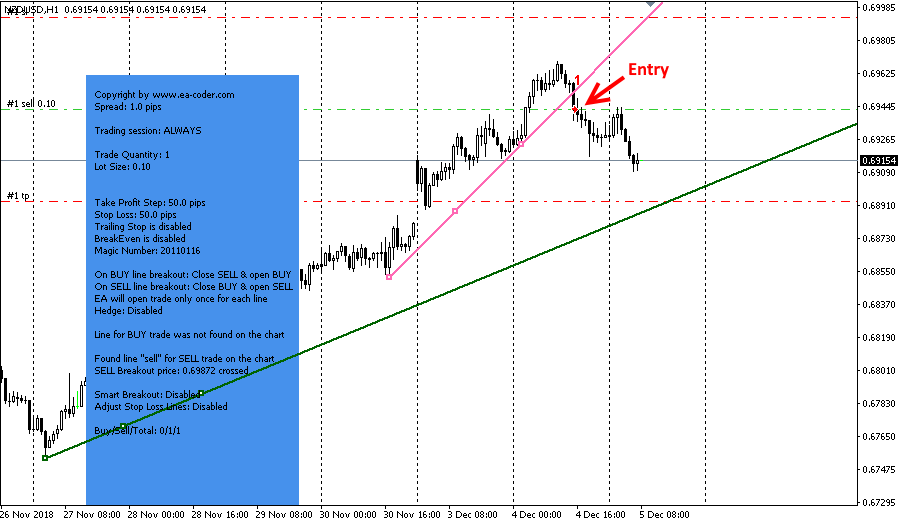
In figure 4, we have an example of this trading system with a short setup. The green rising trend line is the main trend line, which as you can see spans across a longer time span. As price makes the second contact with the main trend line, the momentum increases and price rallies higher.
This results in a second but steeper trend line that is plotted on the chart.
Near the top end of this sharp rally, price action briefly turns flat. There is a small spike to the upside, known as the fake-out and following this, price breaks past the steep trend line. A short position is taken at the break of this trend line with the profit target set to the main trend line.
Using the Trendline Trader EA
To make this trading system easier to trade and less time consuming, you can make use of the Trendline Trader EA for the MT4 trading platform.
This EA will enter and exit positions according to the trend lines that you draw. With this EA even short-term trading will be possible besides a normal day job.
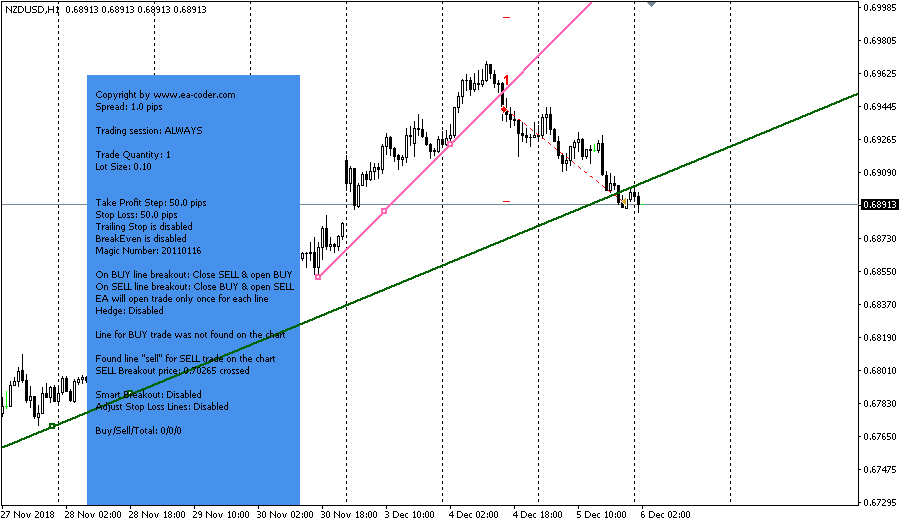
All you need to do is to spot a steeper trend line setup and draw a trend line accordingly. The trend line labeled with the red arrow in the following screenshot shows such a steeper trend line.
To tell the EA that you want to enter a sell trade when the price drops below the trend line, you simply need to change the name of the trend line to “sell”. This can be done with a right-click on the trend line and then select “Trendline properties…”.
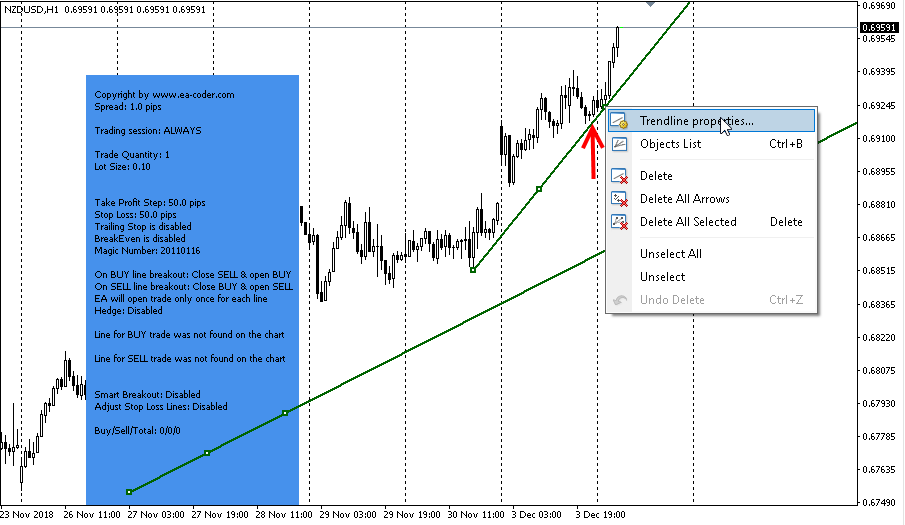
In the properties window simply enter the word “sell” into the Name-field as shown in the following screenshot and confirm by clicking on the OK-button:

Once you configured the trend line properly, the Trendline Trader EA knows what to do. It patiently waits for the price to drop below the trendline.
After the price dropped below the trendline, the EA will enter with a sell order and places the stop and target according to the trade handling settings that you configured in the parameters of the EA:
The trade is over when the target or the stop of the position is reached:
Advantages of using the trend line trading system
You can use the trend line trading system with different entry signals. E.g. the V-Power day trading system waits for special V- and inverted V-formations on the H1 time frame.
You can apply this trend line trading strategy to any time frame of your interest. The only difference is that you need to pay attention to your positions.
This is because the risk you take on a one-hour chart time frame is different when you use a four-hour chart time frame.
Besides tweaking your positions, a bit, this trend line-based trading system with the double top or double bottom pattern can enable you to enter the trade with a great level of confidence. There will be some losing trades no doubt. However, if you follow the trade setups closely and pay attention to the risk/reward setups that come with each trade, you will start to see your profits building up consistently.
Consistency is one of the main aspects of trading that will determine your success. This trend line-based trading system does exactly that.