Candlestick trading is not something that I am actively involved with. My personal style of trading is more based upon price breakouts or using various combinations of indicators in trading robots. But there are tons of traders out there who trade and swear by these price patterns. Let’s take a look at many of the most common patterns and see how we can use them in our day-to-day trading to find better entry points.
In this article you will learn how to read candlestick charts in Forex trading.
Trading Candlestick Patterns
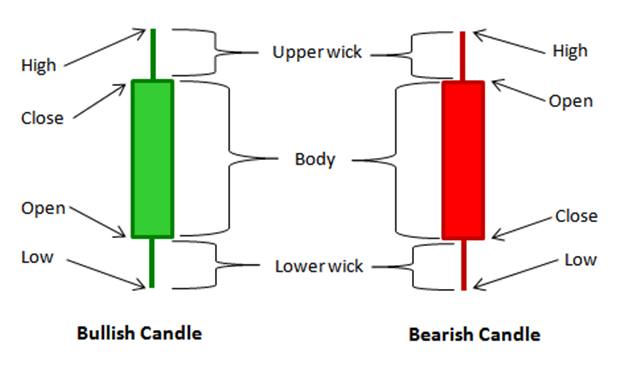
Candlesticks are graphical representations of price movements of a currency pairs over a period of time. Candlestick charts are commonly used in the Forex market because it is easier to interpret, compared to line charts and bar charts. A single candlestick represents any period of time on a trading platform, depending on time frame used. A candlestick on a daily timeframe represents one day of price history, while a candlestick on a 15-minute timeframe represents fifteen minutes of price history.
A candlestick reflects four vital pieces of information:
- The opening price,
- the highest price during that specific period of time,
- the lowest price during that specific period of time, and
- the closing price
A bar chart also reflects these four pieces of information; however, a candlestick clearly denotes the relationship between the opening and closing prices through the body and wicks. The candlestick’s body forms the rectangular shape between the opening price and closing price. The body reflects the range between the opening and closing prices of the currency pair on that certain period. Traditional bodies of candlesticks are colored with black and white to easily define the market direction. Market direction can be either bullish or bearish, depending on the opening and closing prices of the candlestick.
A white body indicates that the closing price is higher than the opening price, which means the price had increased over the period, which defines a bullish candle. A black body indicates the opposite; the closing price is lower than the opening price, which means the price had decreased over the period, which defines a bearish candle. Candlesticks make it easier to see if the prices increased or decreased at the trading period. Other traders use blue or green colors instead of white for a bullish candle, and red for a bearish candle instead of black.
In a bullish candle, the distance between the closing and highest price of the candlestick is called the upper wick, also called as upper shadow. The distance between the opening and lowest price of the candlestick is referred to as the lower wick, also called as lower shadow.
In a bearish candle, the distance between the opening and highest price of the candlestick is called the upper wick, while the distance between the closing and lowest price is called the lower wick.
Interpretations of Candlestick Body and Wick Lengths
Candlestick body and wick length can be long or short. Long bodies imply strong buying or selling strength. The longer the body means the stronger the buying or selling pressure. This indicates that either buyers or sellers are in control of the market. On the contrary, short bodies signify less buying or selling activity.
Wicks are very important because it communities rejection or acceptance of certain price levels. Some candlesticks have perfectly equal length of upper and lower wicks, while others have very long upper wick but a very short lower wick, and some have the opposite.
A relatively long upper wick indicates a strong rejection of higher prices above the closing price (in the case of a bullish candle) or above the opening price (in the case of a bearish candle). The same is true on long lower wicks, indicating strong rejection of lower prices. Wicks also indicate profit taking and unwinding of orders from the institutional traders.
If there is no wick on the upper end of the candlestick body, it means that the closing price (in the case of a bullish candle) or the opening price (in the case of a bearish candle) is equal to the highest price of the trading period. Conversely, if there is no wick at the lower end of the candlestick body, it means that the opening price (in the case of a bullish candle) or the closing price (in the case of a bearish candle) is equal to the lowest price.
Whatever strategy or method you use to trade the forex market with the candlestick charts, you are always looking at price and price patterns. Familiarizing yourself with the different candlestick patterns and its behaviours will greatly enhance any strategy or system. Reading the candlestick patterns alone could provide you information as to where the market direction is going.
Basic Forex Candle Stick Patterns
Below are the 15 principal candlestick types and patterns:
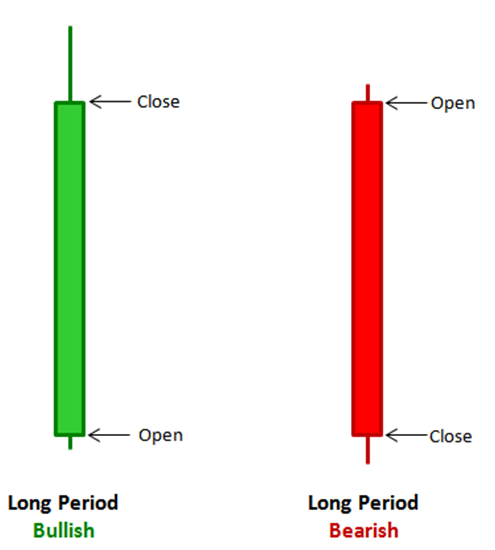
1. Long Periods
Long periods show a significant length between the opening and closing prices during the trading period. Typically, the wicks at either sides of the candlestick body are relatively short, showing that the market is heavily imbalanced.
This type of candles usually occurs in the market during extreme volatility. It indicates a very strong buying pressure (in the case of a bullish long period) or very strong selling pressure (in the case of a bearish long period). Traders with huge orders are heavily participating in only one direction of the market during the trading period.
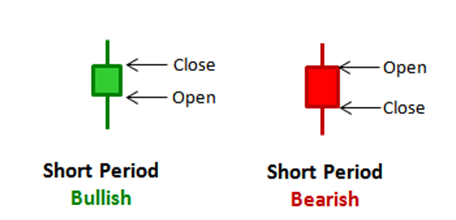
2. Short Periods
Contrary to long periods, short periods have compressed candlestick bodies, indicating a very little price movement during the trading period. Short wicks at either end shows a very little fluctuations of prices between the open and low price and between the high and close price (in the case of a bullish short period candle). The same as true with a bearish short period candle. Short bodies indicate a very little buying or selling activity.
3. Marubozu
A Marubozu type of candlestick has no wicks at either ends of the candlestick, representing a strong buying or selling pressure.
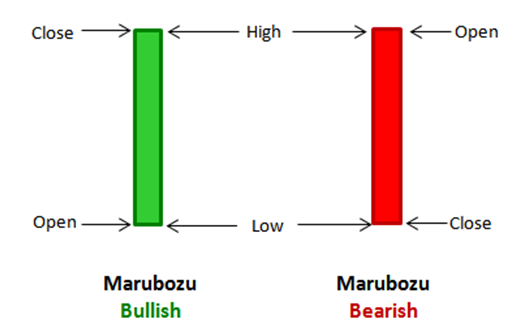
A bullish Marubozu has a long body with no lower and upper wicks. The open price was equal to low price and the close price was equal the high price, which means that buyers are fully in control of the market during the entire trading period. A bullish Marubozu typically starts the continuation of a bullish trend after a retracement or pullback, or starts bullish reversal pattern.
A bearish Marubozu has also a long body with no lower and upper wicks. The open price was equal to the high price and the close price was equal to low price, which means sellers are fully in control of the market during the entire trading period. A bearish Marubozu typically starts the continuation of a bearish trend after a retracement or pullback, or starts a bearish reversal.

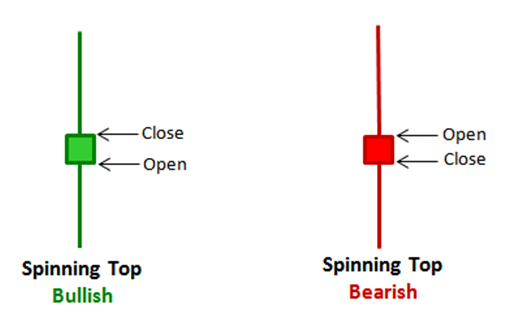
4. Spinning Tops
Spinning tops have longer wicks than bodies. The open and close prices of the candle are very close, which means the market price did not really increased or decreased at the end of the trading period. Whether bullish or bearish, the market direction is insignificant since spinning tops simply indicate market indecision.
5. Doji
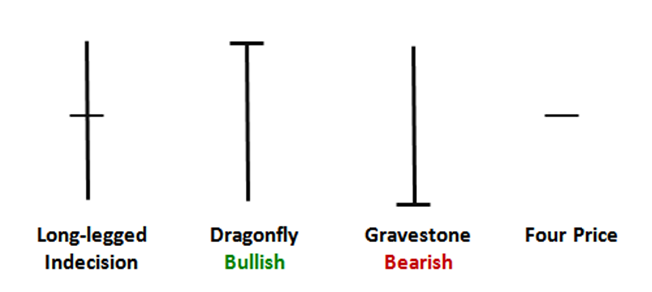
Doji candlesticks have the same (or almost the same) open and close prices or their bodies are extremely short. There are four variations of Dojis, depending on where the opening and closing prices are in relation to the candlestick’s range.
The doji candles represent and tend to show market indecision. The bulls aren’t winning and the bears aren’t winning. The market is in a state of stalemate. Doji’s are often found at the end of a trend move or during times of consolidation where there is little buying or selling momentum.
A long-legged doji has long upper and lower wicks, indicating that prices fluctuated on both sides during the course of the trading period. Eventually, the trading period ends with the close price retracing back to the open price. This type of doji indicates market indecision. Neither buyers nor sellers were able to dominate the market and eventually resulted to a draw.
A dragonfly doji has a long lower wick with no or very short upper wick. The open, high, and close prices are almost equal. This type of doji indicates that all price activity during the entire trading period was on the lower side of the open price. This pattern often signals a bearish trend reversal.
Contrary to a dragonfly doji, the gravestone doji has a long upper wick with no or very short lower wick. The open and close prices are equal or almost equal to low price. It indicates that all price activity during the entire trading period was on the upper side of the open price. This pattern often signals a bullish trend reversal.
Four-price doji rarely occurs in the Forex market, wherein the open, close, high and low prices are the same. This only happens when trading is suspended for that trading period.
6. Hammer
A hammer candlestick has a long lower wick that is about two or three times long as the real body, and with little or no upper wick. The real body is at the upper end of the candle’s trading range. A hammer only occurs in a downtrend.
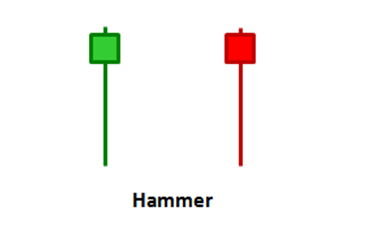
The hammer is a bullish trend reversal signal, regardless of the candlestick’s colour. When the market is trending downwards, a hammer signals that buyers are now entering the market and may take over the market control very soon.
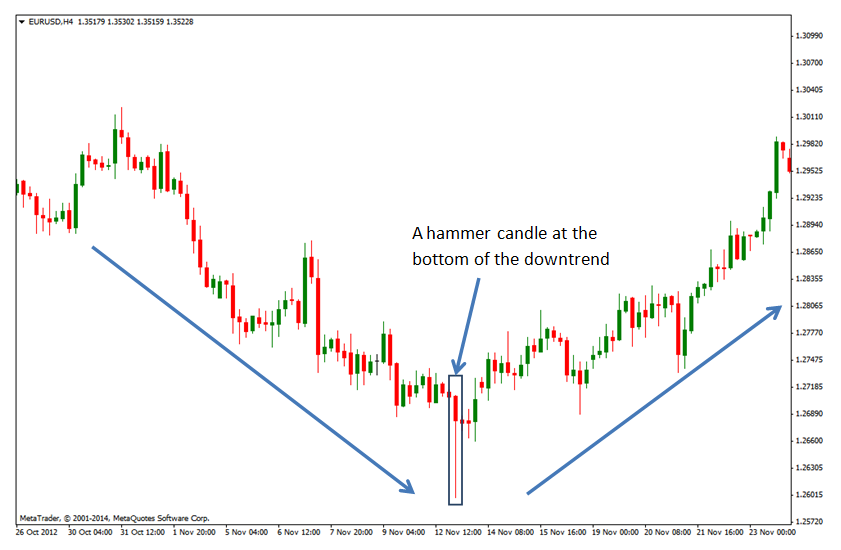
On the H4 chart of EUR/USD above, the market was trending downward, but the bearish strength was stalled by the hammer candle. The long lower wick of the hammer indicated that sellers forcefully pushed the prices lower. However, buyers put a lot of orders with huge volumes, overcoming the very strong selling pressure. Buyers rejected 85 pips and closed the market very near the open price. The downtrend eventually reversed.
7. Inverted Hammer
Similar to a hammer, an inverted hammer occurs at the bottom of a downtrend and can indicate a trend reversal. Is has a long upper wick that is about two or three times long as its real body, with little or no lower wick. The inverted hammer candle must be a bull candle, and proceeded by a bear candle.
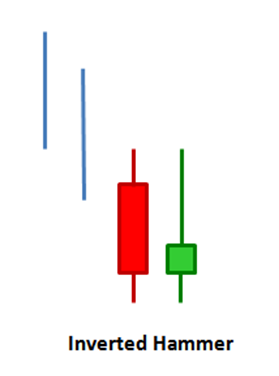
Its long upper wick implies that buyers tried to bid higher prices, but the selling pressure is strong enough and rejected higher prices. Sellers were able to pull the price back; however buyers had absorbed some of the sell orders and managed to close above the open price. This pattern indicates a trend reversal, depending on the type of candle next to it.
8. Hanging Man
The hammer and hanging man are visually identical, but have absolutely opposite meanings depending on the price action that preceded it. Similar to a hammer, a hanging man has a long lower wick that is about two or three times long as its real body, with no or little upper wick. Although the candle can either bullish or bearish, a bearish candle adds more weight to its interpretation.
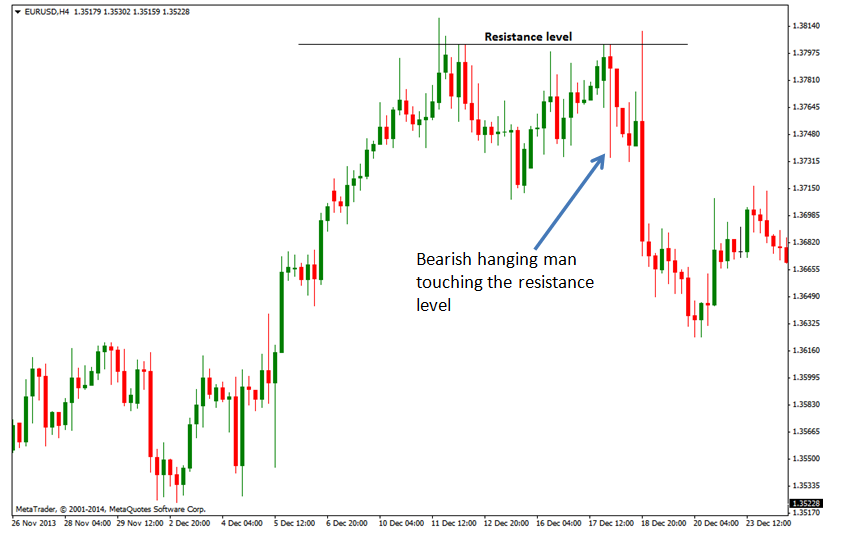
The hanging man is a bullish reversal pattern depending on the market condition around it. On the chart above, the hanging man formed near a resistance level, indicating that huge numbers of sellers are now coming in the market and beginning to outnumber the buyers. Sellers pushed the prices lower, erasing 28 hours of bullish gains. However, buyers immediately pushed the prices back up. The candle closed bearish, showing that buyers were still outnumbered by the sellers. The next candle opened and captured immediate selling and closed bearish.
9. Shooting Star
The shooting star looks identical to an inverted hammer but occurs during an uptrend. This pattern is a bearish reversal signal, with a long upper wick that is two to three times long as its body and may have either a very short or no lower wick. The candle can be either bullish or bearish, but a bearish candle has more weight on the upcoming reversal.
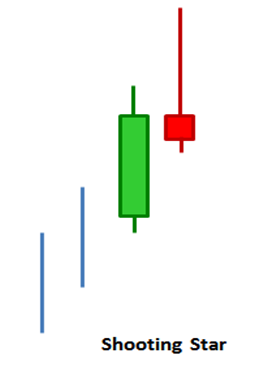
On the illustration above, a bearish shooting star pattern formed on top of the uptrend. The pattern indicates that buyers initially pushed the market higher, but sellers came in near the high and pulled the prices back to the bottom and closed the candle below the open price. This means that buyers attempted to push the prices up, but sellers are more powerful and absorbed the buyers.
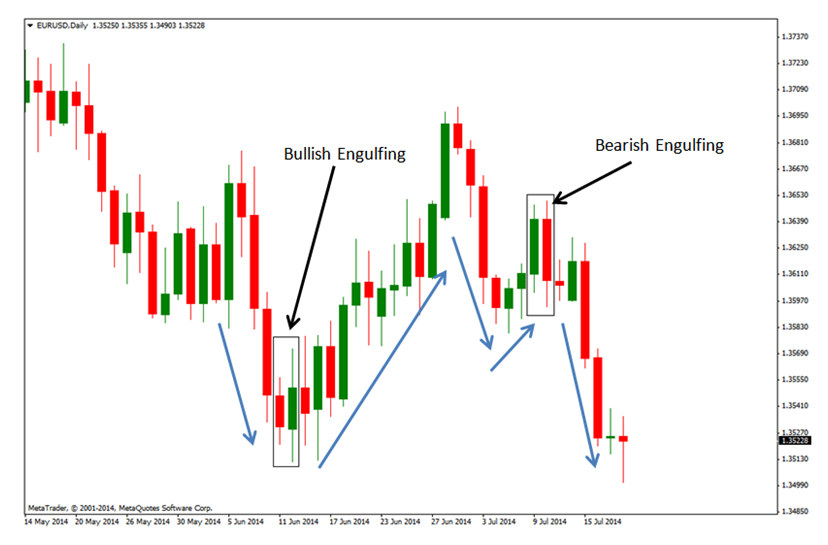
10. Engulfing candles
Engulfing candle pattern forms when candlestick’s real body completely engulfs the preceding candlestick’s body. The pattern consists of two candlesticks (A and B candles) that signal a trend reversal.
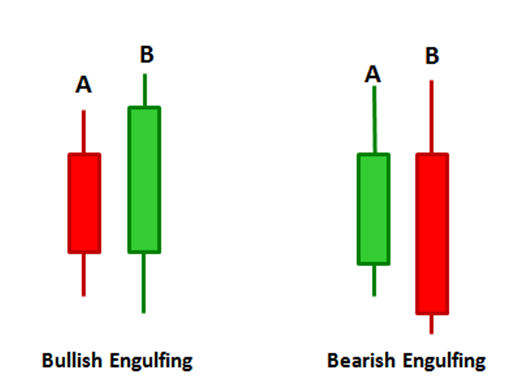
A bullish engulfing pattern is a bullish reversal signal. It forms when a bearish candle (A) is succeeded and engulfed by a larger bullish candle (B). The longer the body of the B-candle, the more significant the price increase.
A bearish engulfing pattern is a bearish reversal signal that forms when a bullish candle (A) is succeeded and engulfed by a larger bearish candle (B).
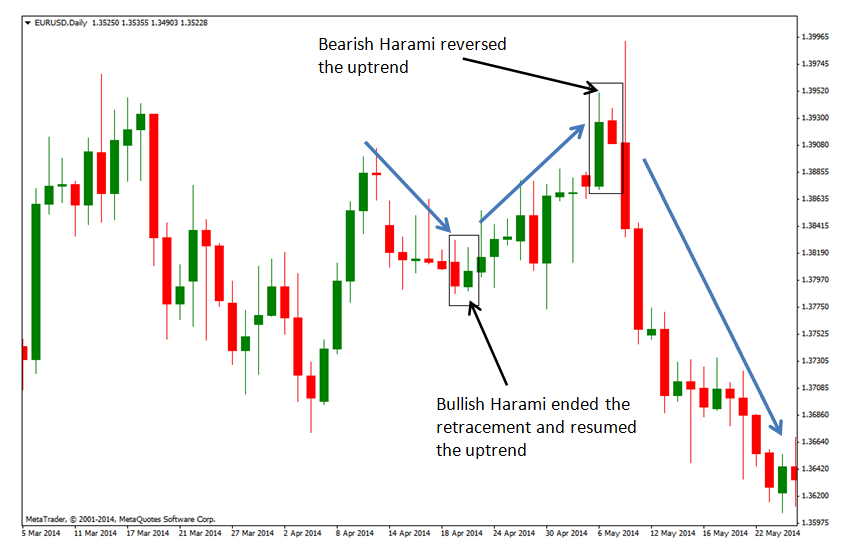
11. Harami/Inside Bar
The harami, also called as inside bar, is the opposite of the engulfing pattern. It is a trend reversal pattern that consist of two candlesticks (A and B candles), with the body of candle B completely inside the body of candle A.
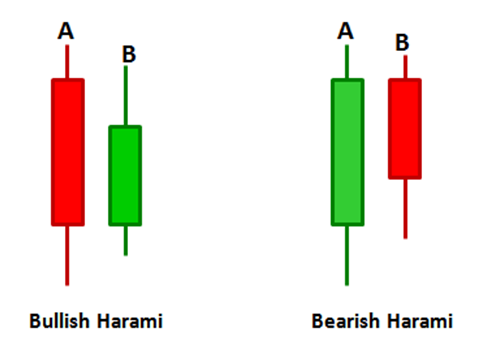
A bullish harami occurs in a downtrend and may signal a trend reversal. Candle A must be a bearish candle, while candle B must be a bullish candle and the body must be shorter than the body of candle A.
Opposite to a bullish harami, a bearish harami occurs in an uptrend and a bearish trend reversal. Candle A must be a bullish candle, while candle B must be a bearish candle with the body shorter that the body of candle A.
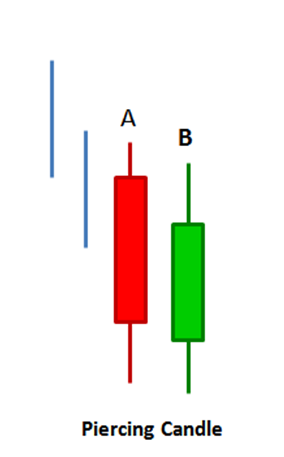
12. Piercing Candle
A piercing pattern is a bullish reversal signal that occurs in an established downtrend. It consist of two candles (A and B), where A is a bearish candle, and B is a bullish candle. The open price of candle B may be equal or below candle A’s close price. The close price of candle B must be equal or above the midpoint of candle A’s body (candle B pierces the midpoint of candle A), but not above the open price of candle A.
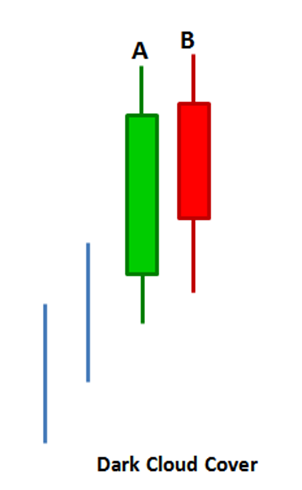
13. Dark Cloud Cover
The dark cloud cover is a bearish reversal pattern that forms in an established uptrend. It consists of two candles (A & B), where candle A is a bullish candle and candle B is a bearish candle. The open price of candle B may be equal or above candle A’s close price. The close price of candle B must be equal or below the midpoint of candle A’s body (candle B pierces the midpoint of candle A), but not below the open price of candle A.
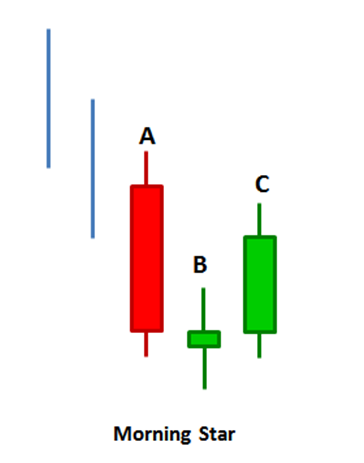
14. Morning Star
Morning star and evening star are three –candlestick pattern that usually ends a trend. It is a trend reversal signal pattern, depending on the price action around it.
A morning star is a bullish reversal pattern that happens during a downtrend. It must satisfy all the following conditions to be a valid morning star bullish reversal pattern:
- Candle A must be a bearish bar during an established downtrend
- Candle B can be a bearish or bullish. It must have a short body (or a doji), indicating an indecision in the market.
- The third candle must be a bullish candle. It must close at the midpoint or above the midpoint of candle A’s body to confirm that a trend reversal is in play. If candle C closed between the midpoint and open price of candle A, the candle next to C must be bullish and closes above candle A’s open.
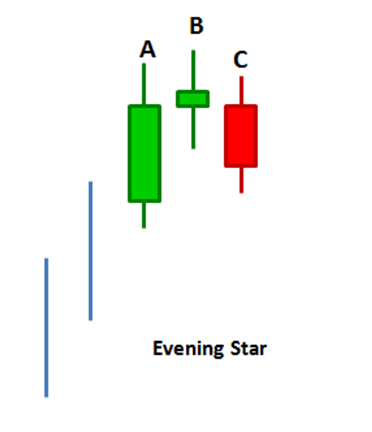
15. Evening Star
An evening star is the opposite of a morning star. It is a bearish reversal pattern that occurs during an uptrend. It must satisfy all the following conditions to be a valid evening star bearish reversal pattern:
- Candle A must be a bullish bar during an established uptrend
- Candle B can be a bearish or bullish. It must have a short body (or a doji), indicating an indecision in the market.
- The third candle must be a bearish candle. It must close at the midpoint or below the midpoint of candle A’s body to confirm that a trend reversal is in play. If candle C closed between the midpoint and open price of candle A, the candle next to C must be bearish and closes below candle A’s open.
Conclusion
Understanding what the candlestick patterns are communicating to you is the most important. However, trading just the candlestick patterns, with or without additional indicators, is very elementary way of understanding the market. You really need to understand the order flow behind the patterns and should consider the market condition to trade these patterns profitably. PLUS, don’t forget about our ‘master’ when it comes to support and resistance areas. You’ll want to read much more about support and resistance before you try to trade any of these patterns.
If you find my explanation of Candlesticks too confusing, you should look at this infographic from HantecFX: Basic Japanese Candlestick Patterns.
Have you tried to trade candlestick patterns like these before? I hope this guide has been helpful for your trading. Please post any questions below or your comments about these chart patterns. Is there one pattern that you’ve seen to be more reliable than the others?
13 replies to "Candlestick Charts: Read & Understand 15 Amazing Patterns"
You have done a very good job with this candle stick pattern please keep the good work up
Dear Vernell, thank you. I am glad you like it.
Regards,
Rimantas Petrauskas
…. first of all congratulate you did a good job at all ….
I really liked this article ….
if they do not mind
if you are in a candlestick indicator can even be shared with me…
thanks
Thanks for your feedback. I am glad you like my work.
Regards, Rimantas
Thank you so much , I could get big knowledge ,Thank you so much Again Thank you so much
I am glad it was helpful 😉
Regards, Rimantas
Thanks a lot Rimantas. It is very complete and simple explanation about candle stick patterns and their relationship with market situation. Always successful to you.
You’re welcome 😉
Hey I think Hammer is a bullish trend reversal.
Yes, you are right. There was a typo. Thank’s for the note. I’ve fixed it.
Hi sir you are great of a man
your lesson is powerfull i love it
so much
thank you sir.
send:petrusi stanley
from,Suriname,Parmaribo
country of south Amerika.
hello, am new hope this article is vey informative and easy to understand the pattern. I read all this article and now am doing practical on candlestick forum. thanks a lot
Thanks very informative and easy to understand.