Many forex traders make use of technical indicators to guide them in predicting and making the right trading decision. In some cases, a good number of these traders end up using indicators that instead mislead them.
In this information age, scammers are all over the internet preying on unsuspecting buyers of their products. A lot of forex indicators are on sale, promising to give unmatched results only to turn out to be scams.
This article focus is on repainting indicators. The concept of repainting has been used by a number of scammers. Repainting makes indicators so appealing when assessed on historical charts but not the case in real time trading. To break it down we differentiate between repainting and non-repainting indicators.
What is a repainting indicator?
Repainting indicator is an indicator that keeps changing its values. Repainting indicators always use future data (bars to the right) to come up with values and entry signals. This is how repainting indicators make sure their historical entry and exit signals look extremely accurate and flawless.
What is a non-repainting indicator?
Unlike repainting indicators, non-repainting indicators do not change their values after the price bar is closed. They normally make use of the price bars to the left when calculating their values.
Non-repainting indicators never change their values on the closed bars. Once a certain bar has closed, these indicators will not change values on any of the closed bars. Each closed bar has its open, close, high and low levels which never change whenever a bar has closed. An indicator value too should not change as long as they are based on closed bars.
Difference between repainting and non-repainting indicators
In the picture below, the indicator recalculates its value based on the current price. In normal practice, you will find such an indicator constantly firing false signals that do not reflect on your historical chart. For example, the indicator might give 5 signals, were 3 of them are wrong and disappear later on leaving the trader with only 2 entry signals on the chart.

In this illustration, we see a BUY entry signal and a trade already open. Now, look at the next picture where it is clearly seen this BUY signal got disappeared a few bars later.

As you can see the trader closed previous BUY signal and followed with the SELL signal and then again with another BUY signal. Both, BUY and SELL signals disappeared and not even visible on the chart. So now it looks like those trades were taken with the reason, but actually, this MT4 repainting indicator fooled the trader.
This process of MT4 repainting entry signals is well demonstrated in this video.
But after all, repainting is not a bad concept, this will become clear as we move on.

For example, the moving average values of the current price bar will keep adjusting as price changes, but once the bar closes, the moving average will stop changing for that closed bar. This whole idea is not selective on the type of price indicator whether leading or lagging indicator. This indicator usually will become static whenever a price bar closes, this will prevent any other formation or any deviation of the indicator after the price close.
This is not the case for repainting indicators as values may change on closed bars when working with repainting indicators. Repainting indicators usually use bars to the right in calculating values.
Where a non-repainting indicator is supposed to utilize the open prices in calculating its values, then that indicator should not repaint at all. Once a bar opens, its opening price will always remain constant. Therefore, in this case, the indicator should not recalculate values.
For example, if we use the open price to calculate moving average, no repainting should happen as there is only one open price per bar which will never change. This is not the case with repainting indicators.
In some cases, several indicators are created to calculate their values using the close, high or low prices. In such an instance the indicator will always repaint as the new bar forms. In coming up with the high, low or the close price the indicator will have to constantly make use of the current price until that bar closes. Remember, as the prices swing up and down, new highs and new lows are likely to be formed and ultimately the closing price. Therefore, the indicator keeps on repainting until the bar closes. If for example, the 10 SMA is to be applied on the bar close on the 5 min chart, the tail of the MA will be moving up and down until the bar closes.
Good and bad repainting indicators
As indicated earlier in this article, not all repainting indicators are bad. There are good and bad repainting indicators. Some good indicators such as the zigzag and fractals are not meant to fool users. All a trader need to do is learn how to use them. Fractals and zigzag help traders identify specific patterns, therefore, they keep changing as price changes. Remember, you can’t force a pattern to form; the indicator has to follow the prices until the pattern forms.
How to tell a difference between good and bad repaint indicators
First and foremost it is necessary to take caution when dealing with these indicators. Where the creator of a repainting indicator does not mention to the users that the indicator is repainting, chances are high it is a bad indicator and users are likely to be fooled. An honest creator of an indicator should disclose to the users all material facts of the indicator.
In other cases, the indicator may fire some entry signals which later disappears when prices move in opposite direction. If this happens, it is a clear indication that it is a bad repainting indicator which cannot be relied upon. Entry signals should not disappear once they appear on your chart. All entry signals issued by the indicator should remain on the chart to help users gauge the reliability of the indicator.
An example could be when an indicator gives a buy signal and you decide to go long, thereafter the indicator could show sell and decide to sell too. However, maybe on the next signal which may give you and you decide to follow the indicator may disappear because maybe it was a false signal. This exposes your open trade to losses and maybe you could be forced to close the trade or probably wait for the next indicator that will show and take the position it tells you. This may happen a lot of times and may lead to unforeseen losses and boredom especially if you are working on small time frames.
By the fact they are disappearing whenever a false entry signal forms, this creates a false visual impression to any unsuspecting trader who is interested in that indicator. This is because it shows near perfection entry and exit points. This happens because the indicators use price bar prices that are on the right.
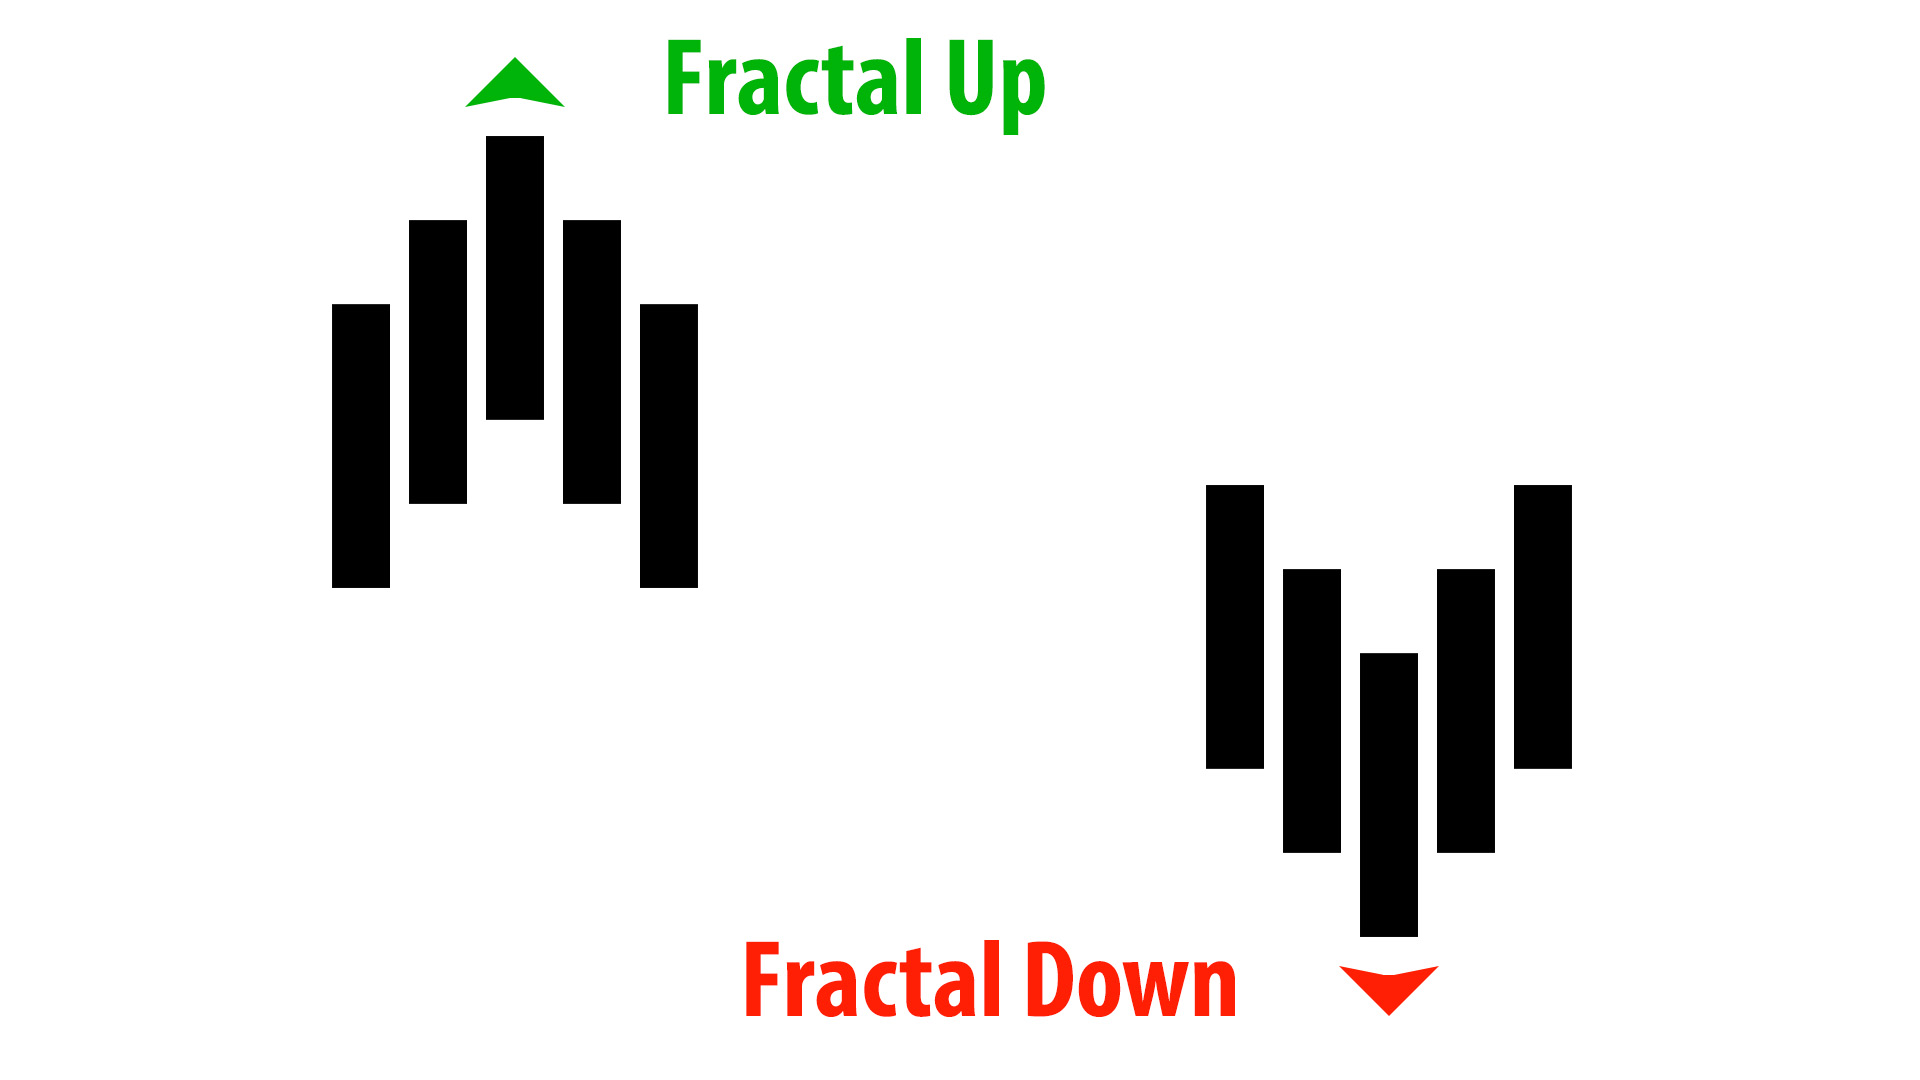
Fractals – a good repainting indicator
In the case of fractals up and fractals down some signals may disappear, which is totally okay. Fractals are normally formed of five bars. For fractals up the highest bar will normally fall in the middle as two bars on both sides form lower highs around the middle bar.
For fractals down, the lowest bar will fall in the middle while the successively two higher low bars will form on both sides. The fractal sign appears as the last two bars are forming, in some cases, the fourth or the fifth bar may go up above or down below the middle bar ruining the chances of a Fractal Up and Fractal Down forming successively. In this case, the indicator sign disappears, but it doesn’t mean it’s a bad repainting indicator. It only means the fractal did not form. Once this pattern of five bars is successfully formed, and the fifth bar closes, the signal will not disappear. Fractal is a good indicator which records high success rate only when traders know how it works.
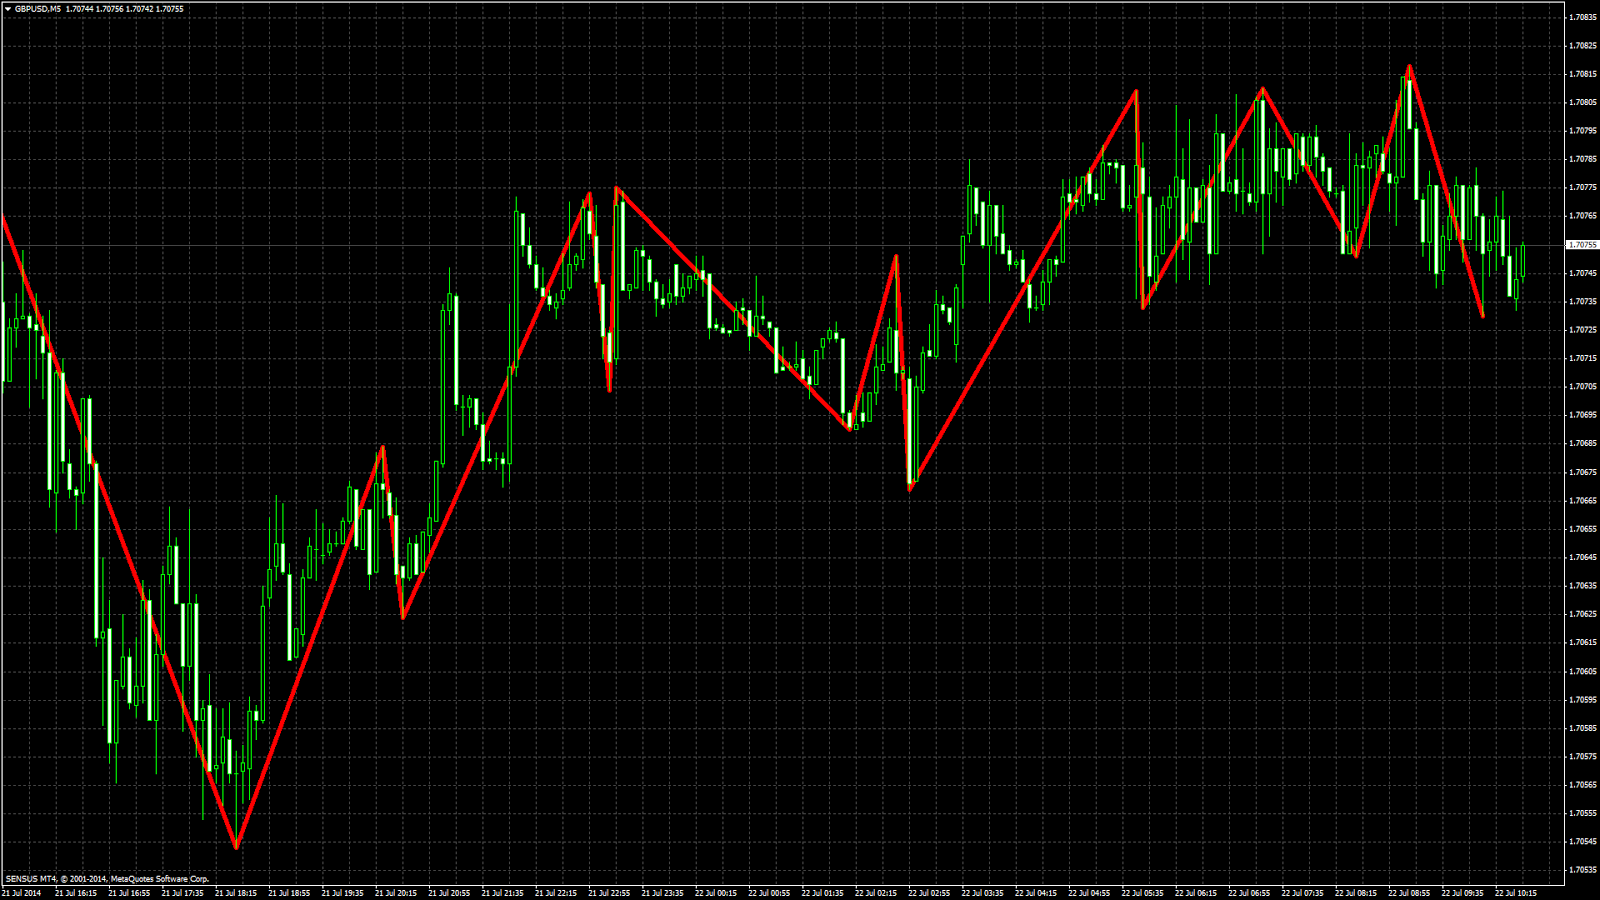
ZigZag – another good repainting indicator
In the case of a ZigZag indicator, the indicator keeps repainting and that is how it was created to do. The ZigZag indicator is used to predict when a certain security’s or stock’s momentum is about to reverse. As it shows the highs, lows, swings and waves, new highs or lows will be formed, this indicator will adjust accordingly to reflect the change. In this case, the indicator moves in the way of prices. As earlier said, patterns will be formed from prices; therefore, this indicator must change with the changes in prices.

How bad repainting fool traders
As indicated earlier, bad repainting indicators will normally fire signals and then recalculate its values using bars to the right. If the signal given earlier on was wrong, it will disappear from the chart and a fresh signal will be issued. When a user reviews the historical performance of such an indicator, it will show perfect entry signals, but in a real sense, every false signal issued disappeared later.
Secondly, bad repainting indicators will normally seem to perfectly predict support and resistance levels. However, the indicators will keep adjusting these levels whenever new or high prices form. The users of such indicators will end up working with wrong levels only to discover the level were changed as prices changed.
Bad repainting indicators always use future data (bars to the right) to come up with values. This is a trick to make sure their historical chart will be filled with excellent entry points.
Steps to verify if indicator is repainting or not
- Use MT4 Strategy Tester
- Run a backtest of selected indicator
- Use low time frame to see results faster
- Non-repainting indicator values should remain unchanged after price bar closes
- Repainting indicator values are replaced on already closed price bars.
How to check indicator repainting
There are a number of ways traders can do to verify if the indicator they are using is repainting or not. The use of the Meta trader strategy tester is one of the most recommended ways. From the Meta trader platform, you can easily access the strategy tester from the top menu. Fill in the parameters such as the indicator to be tested, period and the date range to be tested. With the appropriate speed, the user can successfully test their indicators. You can mark and take screenshots so as to compare the before and after charts.
It is recommended that when doing the testing lower time frame should be used. When one uses lower time frame, you are able to obtain results faster. A time frame of one minute or five minutes will let you obtain faster results compared to testing using a four-hour time frame.At the same time, the testing should be carried out at the right speed, not too fast to miss some details and again not too slow as one may lose focus. The Meta trader has a meter that will help users adjust to the right speed for them.
At the same time, the testing should be carried out at the right speed, not too fast to miss some details and again not too slow as one may lose focus. The MetaTrader has a meter that will help users adjust to the right speed for them.

If indicator values keep changing on closed bars, then what you have is a repainting indicator. Non-repainting indicator values should remain unchanged on all closed bars. If the values are being replaced after price bars close, then that is a repainting indicator. On the same note, if false signals are missing from your chart the indicator is a repainting one.
How to stop indicator repainting
The only way to stop indicator repainting is to reprogram it. Sometimes it might be just a simple task changing a few lines of code and sometimes it might be a really difficult job to complete because indicators can be very complex. In most cases, once the indicator is re-coded to stop using bars on the right it will become a normal non-repainting indicator. Don’t be surprised when the same indicator will show mostly only losing entry signals after it is converted into the non-repainting indicator.
Conclusion
Non-repainting indicators in real life are less problematic. Though most of them have a lagging tendency, they are highly valued as the information they provide doesn’t change. Looking at the historical charts of such an indicator may not be that appealing, but their reliability coupled with their ability to be used alongside other indicators makes them more dependable. Many traders find it extremely frustrating to use repainting indicators. The historical results from these indicators are excellent, and at some point, traders may think they have just hit the “holy grail” only to realize in real time the results are far from what they saw earlier.