If there is one aspect of trading that many traders seem to spend much less time on than they should, it is in the objective evaluation of their trading system performance. It seems to be an activity that often gets brushed aside. However, I cannot overemphasize the importance of tracking and monitoring your performance. This article will highlight five key performance metrics that every trader should start paying more attention to as it pertains to their own trading program.
Win Percentage
One of the easiest to understand trading metrics is Win Percentage. It tells us how many winning trades that we have in relation to the total number of trades taken.
For example, if the total number for trades taken is 140 and the number of winning trades was 77, then the win percentage would be 55% in this case:
(77 Winning Trades / 140 Total Trades) = 55% Win Percentage
This is fairly simple to understand for most traders. Generally, many traders tend to aim for a high win rate, however, a win rate alone does not make for a profitable trading system. The average size of your winning trades and the average size of your losing trade also needs to be taken into account when evaluating expected profitability.
Said another way, if your win rate is high but your average winning trade is small in relation to your average losing trade, then you may not necessarily have a profitable trading system. At the same time, if your win percentage is low, but your average winning trade is much larger than your average losing trade, then you may have a profitable trading strategy, despite a low win percentage.
Essentially, Win Percentage is important to track, but it should never be considered in isolation.
Here is the example of a Win Ratio figure in the report generated by MyMT4Book Analyzer for two of our trading robots:

Recommended: the FxMagnetic trading indicator for MT4 which shows the Win Percentage of the last 100 trading signals. This tells you if its strategy is still on the winning side so you know it’s worth following FxMagnetic future signals.
Expectancy
Expectancy is one of my favorite trading metrics because it provides a simple but efficient means for evaluating a trading strategy or system at any given account size. Trading expectancy is computed by combining both the average win percentage with the average win:loss ratio.
Expectancy = (Winning Percentage x Average Win Size) – (Losing Percentage x Average Loss Size)
For example, let’s assume that Trader A’s system has the following characteristics:
Winning Percentage: 60%
Average Win Size: 500
Average Loss Size: 400
Can you calculate the Expectancy for this system?
Let’s plug in the numbers:
(.60 x 500 ) – (.40 x 400) = 300 – 160 = 140
Expectancy = $140
So, Trader A’s system has a positive expectancy of $ 140, which means that on average, his system is expected to earn about $140 per trade taken.
Let’s look at another example. Trader B’s system has the following characteristics:
Winning Percentage: 40%
Average Win Size: 450
Average Loss Size: 400
Let’s plug in the numbers once again:
(.40 x 450) – (.60 x 400) = 180 – 240 = – 60
Expectancy = – $60
So, Trader B’s system has a negative expectancy of – $60, which means that on average, his system is expected to lose about – $60 per trade taken.
Largest Losing Trade
Another important metric that a trader should know is their largest losing trade. It will help in system design and stress testing of your strategy. Your largest losing trade is self-explanatory and measures the amount of the single largest loss incurred.
Here is the example of a largest losing trade figure in the report generated by MyMT4Book Analyzer for two of our trading robots:

Obviously, we want to keep our largest loss within a reasonable range, so as not to jeopardy blowing up our account. It is essential to know the reason behind your largest loss so that you can try to contain it in the future.
Was your largest losing trade due to a black swan type of event, that you had no control over? Was it due to poor trade management where a trade simply got out of hand? Or was there some other underlying reason that led to it? You must ask yourself these questions and incorporate proper risk parameters to ensure that if a similar loss or greater happens in the future, that your account will be able to sustain it.
Legendary trader Larry Williams has done a good amount of work on how to position size properly by taking into account your largest losing trade. He believes that the largest losing trade is a trader’s biggest risk factor. He suggests the following position sizing formula:
Contracts to Trade = Account Balance x % Risk / Largest Loss
For example, let’s assume that your account size is $20,000, your personal risk preference is 4% per trade, and your largest loss has been $2000.
Based on this data, the contracts to trade would be computed as follows:
20,000 x .04 / 2000 = 800 / 2000 = .40 contracts.
Maximum Drawdown
Many amateur traders tend to focus on total returns rather than risk-adjusted returns. Total returns by itself are quite meaningless and do not accurately provide a true measure of a system’s performance. Risk-adjusted returns, on the other hand, is a much more valuable way to assess system performance.
Here is the example of a maximum drawdown figure in the report generated by MyMT4Book Analyzer for two of our trading robots:

One way that traders can evaluate their risk-adjusted returns is by calculating their maximum drawdown. Then they could compare the total returns in relation to the risk as measured by maximum drawdown.
But what exactly is a maximum drawdown and how it is computed?
Maximum Drawdown measures a portfolio’s largest peak to valley decline prior to a new peak in the equity curve. Some traders tend to erroneous calculate max drawdown, so let’s try to make it clear with a practical example:
Assume your trading account started at $10,000 and increased to $15,000 over a certain period, and then fell to $7,000 after a string of losing trades. Later, it rebounded a bit increasing to $9,000. Soon after, another string of losses resulted in the account falling to $ $6,000. After some time, you were able to get back on track and get the account level to $ 18,000.
Based on this example, can you figure out what your maximum drawdown was?
The answer is: 40% was your max drawdown.
$6,000 (lowest low prior to new peak ) / $15,000 ( highest peak prior to a new peak )
Below is a visual representation of Maximum Drawdown:

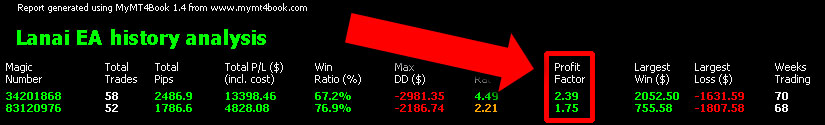
Profit Factor
Profit Factor measures your system’s profitability. Profit Factor is essentially a ratio that compares your total winning amount to your total losing amount.
Here is the example of a Profit Factor figure in the report generated by MyMT4Book Analyzer for two of our trading robots:
You can calculate your trading system’s profit factor using your gross profits and gross losses with the following formula:
Profit Factor = Gross Winning Total / Gross Losing Total.
For example, let’s say that during the course of a year, your winning trades resulted in $ 26,500 profits and your losing trades resulted in $15,250 in losses.
Then based on this, your profit factor would be:
$26,500 / $ 15,250 = 1.74
A profit factor under 1 would mean that your trading system or strategy is unprofitable, a profit factor between 1.10-1.40 is considered a moderately profitable system, a profit factor between 1.41-2.00 is quite good, and finally, a profit factor above 2.01 is considered excellent. So, the larger the Profit Factor, the better the trading system has performed.
Final Thoughts
Every trader should do their utmost to try to understand the inner workings and performance data of their trading system or strategy. We have touched upon five of these key trading performance metrics. They should serve as a starting point from which to build a risk model that you can be comfortable with and apply in a real market trading environment.
Without the proper insight into the strengths and weaknesses of your system, you are relying more on luck than empirical data. And unfortunately for those relying on luck, it runs out sooner or later. As such, it is paramount that you evaluate your trading performance using hard data that can be analyzed objectively. Remember, that which can be measured can be improved.
This article is a guest post courtesy of Forex Training Group. The author, Vic Patel, is a seasoned forex trader with extensive knowledge and experience in the financial markets.
5 replies to "5 Most Important Trading Metrics Explained"
Hi Vic,
Great read on a subject I don’t see too often. One metric that I love and that was bet into us when I was a trainee trader is your ‘take home’ ratio.
All well and good taking home $500 a day, but what if you were up $1500 and gave back $1000. We tracked our high of each day against final take home. It often signaled a turn in our performance.
Sam
Sam – just wanted to thank you for your comment, I find this a very useful metric.
Cheers, Robert
Very good information and very useful, thanks for sharing
How many slave account can be linked in one master account when using your trade copier software?
Actually, the number of clients is unlimited.
It all depends on how many mt4 platforms your PC/VPS can handle open at the same time.
Make sure CPU/RAM is used no more than 70% otherwise it can cause a delay.
Hope this helps.